Task Manager
The Task Manager plugin turns the running processes on your Mac into a folder you can browse. It appears as a TaskManager drive in the drive bar; open it and every process is a row you can sort, inspect like a file, or end — using the same keys you already use for files. It's a plugin, so you can turn it off or remove it in Configuration ▸ Plugins….
Open it
- Click the 📊 TaskManager entry in the drive bar (it sits right after your boot drive).
- The panel fills with one row per running process. Each row's name is the process name followed by its PID, for example
Finder (462). - The TaskManager button stays selected while you are in it, and the tab is named after the drive. Switch to another tab and back — or quit and reopen the app — and the tab returns to the process list. To leave it, go up one level or click another volume in the drive bar.
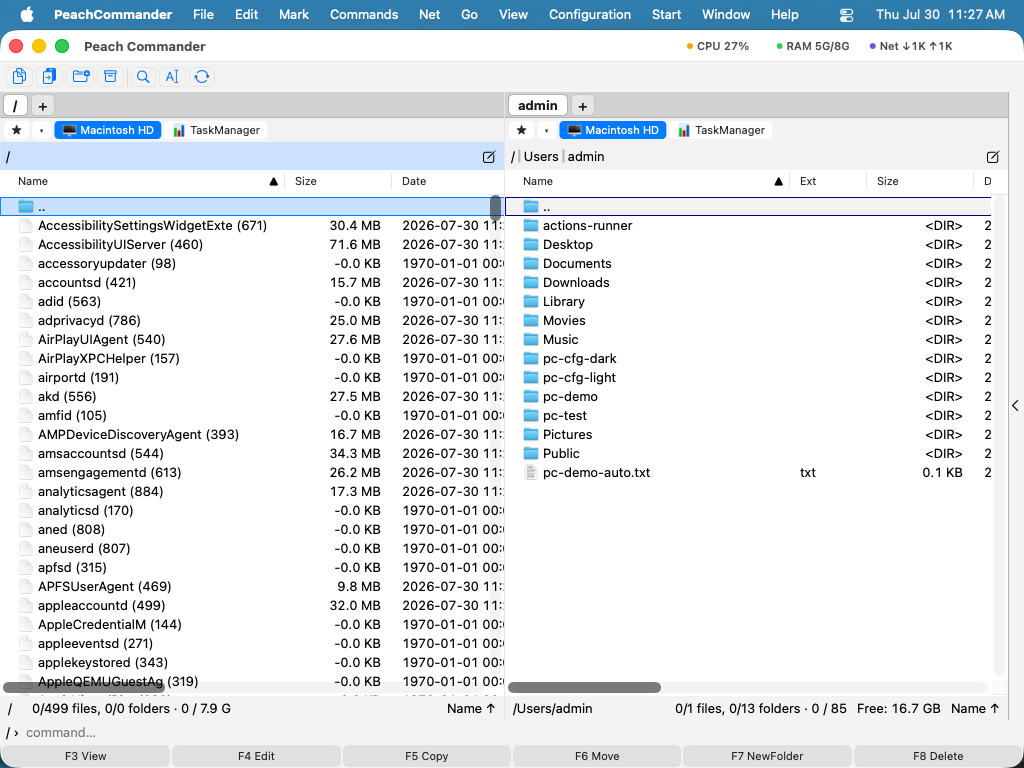 (Figure: running processes shown as a file list you can sort and act on.)
What each column means
Alongside the Date (start time) column, Task Manager adds process columns. A process row's Size reads DIR, because a process is a folder you can open (see below) — memory has columns of its own:
| Column | Meaning |
|---|---|
| PID | Process id |
| CPU % | Recent processor use (needs a second refresh to appear) |
| Memory | Memory footprint — what this process is accountable for (the number Activity Monitor shows) |
| Resident | Resident size, shared pages included; filled for every process |
| Threads | Thread count |
| State | R running · S sleeping · T stopped · Z zombie · I idle, plus the suffixes ps adds (s = session leader, + = foreground, N = low priority) |
| User | Owner |
| PPID | Parent process id |
| Read | Bytes read from disk since the process started |
| Written | Bytes written to disk since the process started |
| Wakeups | Interrupt wakeups since the process started |
| Signed | Who signed the program: Apple, a Developer ID team, ad-hoc, or unsigned |
| Command | Full command line |
Sort by any column (for example CPU % or Size/memory) just as you would in a normal folder.
Inspect or end a process
- View (F3) shows a Process Information report: name, PID, parent, user, state, threads, memory, CPU, start time, executable path, and the full command line.
- Delete (F8) ends the process. The first delete sends a graceful quit (SIGTERM); deleting a process that's still running a second time escalates to a force quit (SIGKILL). The plugin never targets PID 1.
Find the processes using a file
Right-click any row and choose Find Processes by File…, then enter the path of a file. Every process that currently has that file open is highlighted, and the cursor jumps to the first one that can change it:
- Blue — the process only reads the file.
- Orange — the process only writes to it.
- Purple — the process does both.
The path is prefilled from the cursor in the other panel, so you can point at a file there and ask without typing. Find Process by Port… in the same menu answers the sibling question: which process is listening on a TCP/UDP port. Choose Clear File Highlight to remove the colours; leaving the process list removes them too.
Open a process to see its files
Press Enter on a process — or double-click it — and the panel lists the files that process currently has open, as ordinary file rows with their real size and date. From there:
- View (F3) opens the file itself.
- Go to File shows it in the other panel, where you can work with it.
- Reveal in Finder hands it to the Finder.
Only open files count: a library the process merely mapped into memory, and its working directory, are not open files. Another user's process shows an empty folder.
Notes
- Basic details (PID, parent, user, state, signer) are readable for every process. Memory footprint, threads, disk I/O and the list of open files are readable for your own processes, which on a normal Mac is most of the list. For other users' processes, CPU and Resident are filled from
psinstead — a lifetime average rather than the two-sample delta the other rows carry — and threads and footprint stay blank. - CPU % is a change between two samples, so it's blank until the panel refreshes a second time (the panel refreshes roughly every two seconds).
- The list is read-only apart from ending a process — you can't copy files into it.
- The highlight colours follow your colour theme: the Norton palette uses green, red, and magenta instead.
- Only handles your account may inspect are found, which in practice means your own processes. A library a process merely mapped into memory, or its working directory, is not an open handle and is not reported.
- The Signed column fills in over the first few seconds: reading a signature takes about a millisecond and there are hundreds of distinct programs, so they are read a few per refresh and then remembered. A blank cell means "not read yet", not "unsigned".
- Signed says who signed the program, not whether it is notarized: checking a notarization ticket means hashing the whole program, which would take seconds for each one.
- The quick filter (Ctrl+S) matches the columns as well as the name here, and a term can name the column it applies to:
user:root state:Rasks what root is running right now. Terms are separated by spaces and all must match; text that names no column stays one plain substring, spaces included.