System Monitor
The System Monitor plugin puts a live readout of your Mac's activity right in the window's title bar: small chips for CPU, memory, disk, network, and — where the hardware exposes them — GPU, battery, and sensors. Each chip updates once a second; click one for a pop-up with a history graph and a detailed breakdown. It's a plugin, so you can enable, configure, or remove it in Configuration ▸ Plugins….
The title-bar chips
When the plugin is on, a row of compact chips sits in the title bar. Each chip is a colored dot, a short label, and a live value (some with an inline sparkline):
| Chip | Shows |
|---|---|
| CPU | Processor load, with per-core detail |
| RAM | Memory used / total (plus wired, compressed, swap) |
| HDD | Boot-volume space and read/write throughput |
| Net | Download / upload rates and totals |
| GPU · Batt · Sens | GPU utilization · battery charge & state · fan speeds and temperatures |
Click a chip to open a pop-up with the big current value, a HISTORY sparkline, a DETAILS key/value list, and — for the CPU — a CORE LOAD list of per-core bars.
Configure it
Choose Commands ▸ System Monitor… (or open Configuration ▸ Settings ▸ System Monitor) to configure the readout:
- Show system monitor in title bar — the master on/off for the chips.
- Profile — Minimal, Medium, or Maximal presets that pick a sensible set of modules.
- The module table — turn each module (CPU, GPU, RAM, HDD, Net, Batt, Sens) on or off, choose its color, and drag rows to set the order they appear in the title bar. Modules your hardware can't report are shown as (n/a).
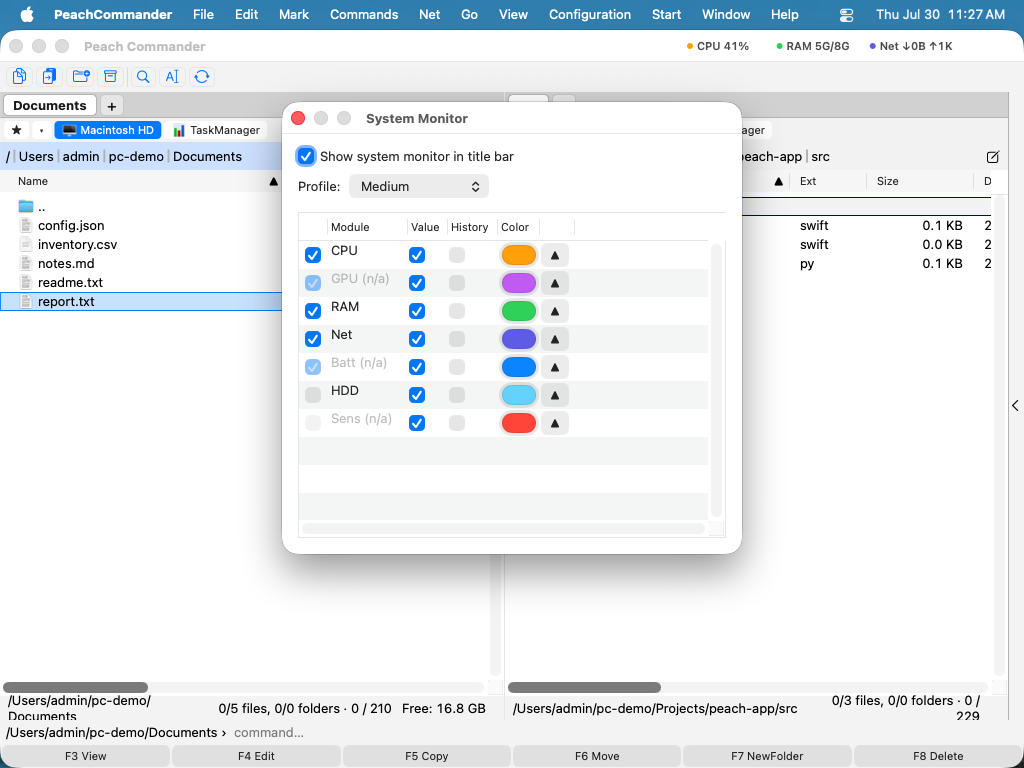 (Figure: choose which modules appear, their colors, and their order.)
Notes
- Everything is measured, never faked: modules whose data the hardware doesn't expose (often GPU or sensors on some Macs) stay unavailable rather than showing made-up numbers. Battery is unavailable on desktops.
- Sampling runs on a background timer only while the readout is visible, and keeps about 30 minutes of history for the graphs.
- Your module choices, colors, and order are saved with the app's configuration.